| 8 mins read
Forty years ago, those in the top one per cent took home around three per cent of all income; today that share has more doubled to around eight per cent. Around thirty-five years ago, one in seven households could not afford three or more basic necessities; by 2012 this had risen to one in three and is likely to have risen further since. And today, around 2 million people in the UK are undernourished and one in five children lives in a household that is either moderately or severely food insecure making the UK perhaps the “worst performing nation in the European Union” when it comes to ensuring its citizens have enough to eat.
But the story of how and why inequality and poverty has changed in the UK is not solely, or even primarily, one in which impersonal economic forces are the main protagonists beyond the control of whichever government happens to occupy the stage at any point in time. Instead, the story is, at its heart, a political one.
For at least thirty years prior to the Great Recession there was a consistent trend for those at the top to earn increasingly more than the rest. But this consistent rise in earnings inequality did not translate into consistently rising income inequality or poverty because government policy was, and is, the final determinant of both.
Both inequality and poverty skyrocketed under the Thatcher government as she made clear that “opportunity means nothing unless it includes the right to be unequal” and then cut the top rate of tax from 83 to 40 percent. She believed the government should not “take money in taxes from those who work hard and pay it out to those who don’t”, and in due course, social security payments, including the state pension, were frozen (or cut) in real terms and grew slower than earnings.
Changing economic circumstances at the time did have an impact on inequality and poverty but it was the government’s policies on taxation and social security that were responsible for around half of the rise in inequality in the 1980s – an impact that was one and a half times greater than the impact of changing employment and three times greater than that of rising earnings inequality.
The pattern of income growth under the Conservative governments of 1979 – 1997 was straightforward: the richer you were, the faster your income grew (see figure one below). Those at the top 10 per cent saw their incomes grow by around 75 per cent compared to around 25 per cent for those at the bottom 10 per cent.
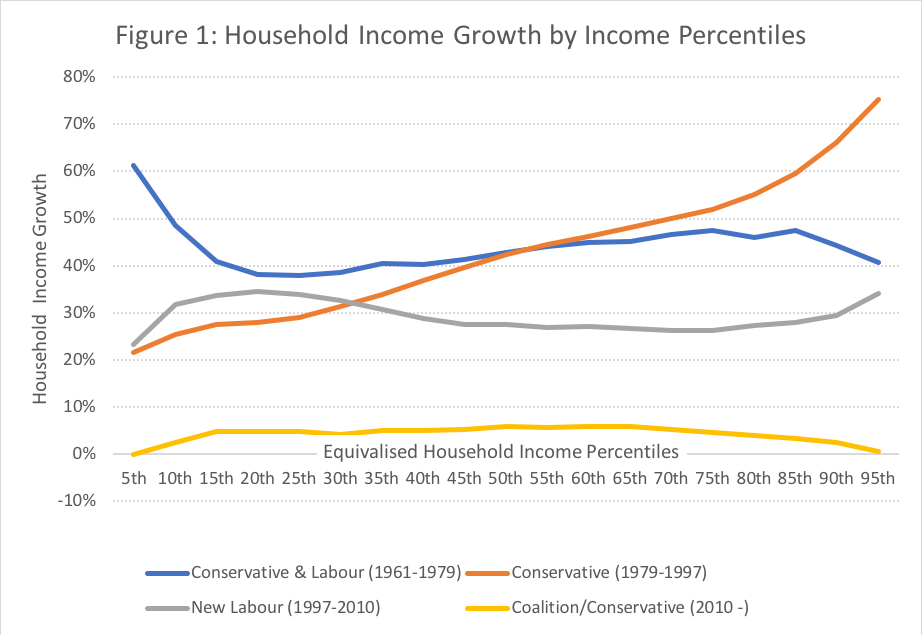
Source: IFS, Living standards, poverty and inequality in the UK
The story of inequality and poverty then changed markedly with the election of New Labour. Tony Blair was clear before he came to office that “the next Labour government [would raise] the living standards of the poorest” and, once in office, promised that he would “end child poverty” in a generation. Gordon Brown made a similar promise regarding pensioner poverty. When they came to office, they set out to do exactly that.
The introduction of tax credits would raise the incomes of low-income working age families; the introduction of pensioner credit would increase the incomes of low-income pensioners; and poverty rates (measured as the proportion of families with less than 60 per cent of median income before housing costs) for both groups subsequently fell (see figure two).
But the poverty rate for working age families without children actually rose in this period. Why? Because the ambition was not to end all poverty; it was to end child and pensioner poverty.
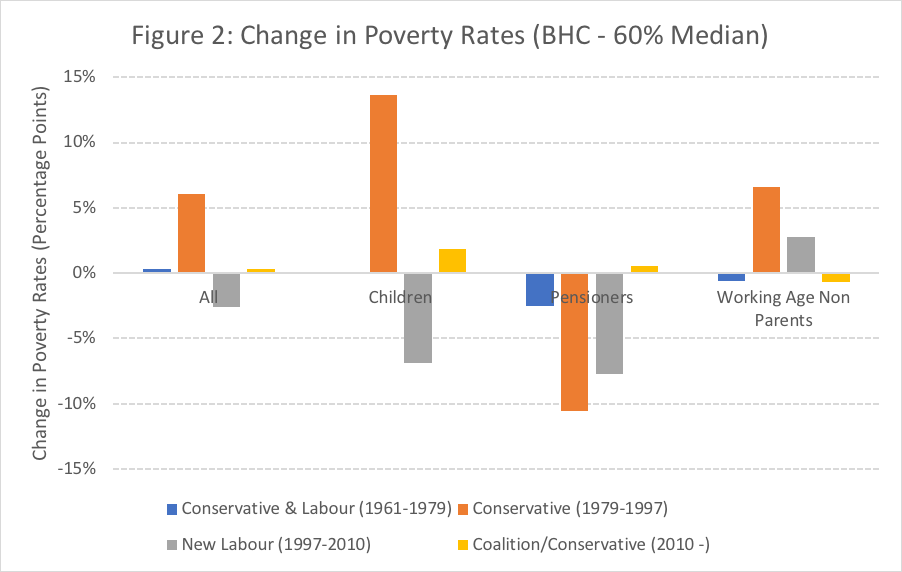
Source: IFS, Living standards, poverty and inequality in the UK
Then came the Great Recession and the post-2010 coalition and Conservative governments, who set out to move the UK from a “high tax, high welfare economy; to … [a] lower tax, lower welfare country”. They abolished the 50p tax rate on high incomes and increased the personal allowance – measures that disproportionately benefited richer households.
They did not believe that reducing poverty could be achieved by “income redistribution” and cut social security payments for low-income working age families. But not all of those on low-incomes faced social security cuts. In the Treasury, the Conservatives may not have had “much time for tax credits… [or] Housing Benefit” but made it clear, “that they will not touch pensioners”.
Now, as the more eagle-eyed will have noticed, figures one and two show that poverty and inequality have barely risen since 2010 despite regressive cuts to taxation and social security. This is because in the aftermath of the 2008 crash, both earnings growth and earnings inequality fell, counteracting these regressive policy changes. Today, as both earnings growth and inequality have begun to return, so too have the first signs of rising inequality and poverty.
The main protagonists in the story of inequality and poverty are governments. When governments change, so does the story. If, tomorrow, New Labour were to return to power and implement their taxation and social security policies, then the story would change once again, with certain subplots seeing dramatic twists.
This is not just idle speculation on my part. Using the EUROMOD tax and benefit microsimulation model, I have estimated what the difference in inequality and poverty rates would be if New Labour’s policies on taxation and social security were implemented tomorrow. I constructed this counterfactual by uprating social security payments & tax thresholds in line with New Labour policy when they left office and uprating the minimum wage in line with actual rises up to 2015 and in line with the 2015 Labour manifesto thereafter (figure three below).
Under New Labour’s policies, inequality would fall slightly while the proportion of the total population living in poverty would be around 2½ percentage points lower. But certain groups would see more dramatic falls – poverty would fall significantly for children (by around 5½ percentage points) whereas poverty would rise slightly for pensioners.
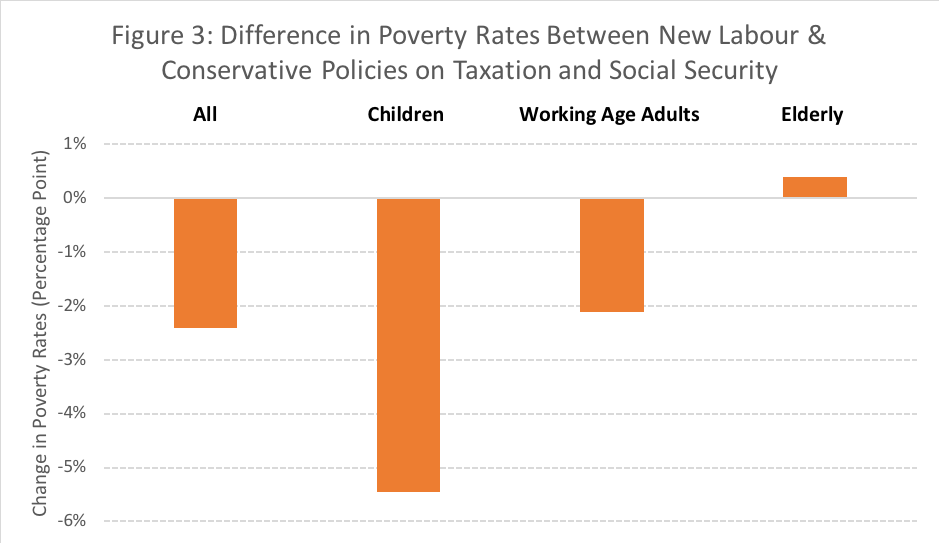
Source: EUROMOD Tax-Benefit Microsimulation Model
Beveridge, the architect of the welfare state, understood the political nature of the inequality and poverty story. In the closing of his blueprint for the post-war welfare state, he declared that “freedom from want cannot be forced on a democracy or given to a democracy. It must be won by them”. That remains as true today as it was three-quarters of a century ago when he wrote it. The story of inequality and poverty is written by governments and, in a democratic society, the people who elect them.