| 8 mins read
The link between popular vote and MPs elected is capricious, to say the least, under the first past the post (FPTP) system.
Between 2010 and 2015, for instance, the Conservatives’ national vote share (36.1 per cent and 36.9 per cent respectively) hardly changed. But whereas in 2010 the party did not obtain a parliamentary majority—necessitating a coalition with the Liberal Democrats—it did so in 2015. Two years later, Theresa May increased the Conservatives’ vote share to 42.3 per cent—their highest level of support the mid-1980s—but in the process she lost the Conservatives’ majority: greater support produced fewer MPs.
In 2015, the Liberal Democrats received substantially fewer votes than the UK Independence Party (UKIP)—2.4 and 3.9 million votes respectively—but only one UKIP MP was elected, compared to eight Lib Dems.
But even by these standards, the UK's 2024 general election stands out as distinctly peculiar. Just four and a half years after their 2019 triumph, the Conservatives crashed to their worst electoral defeat of modern times, reduced to only 121 MPs and 23.7 per cent of the vote.
Meanwhile, Labour achieved its landslide despite only marginally improving on its 2019 vote share, up by a mere 1.6 percentage points to 33.7 per cent. This was the lowest vote share obtained by the winning party at any modern UK general election.
The 2024 results were out of kilter even by FPTP’s usual standards. One Labour MP was elected for every 23,738 votes the party received. For the Conservatives, the ratio of MPs to votes was 1:56,437.
Why were the parties’ returns to their vote shares so out of line with each other in 2024? What was it that helped Labour maximise its returns so well compared to its main rival?
An approach to measuring electoral bias
To understand what happened, we use a well-established method for analysing how biased the electoral system is between two parties. We apply a hypothetical uniform swing between Conservatives and Labour allowing us to compare how many seats each would be likely to win if their national vote shares were tied at 39 per cent (assuming the other parties’ support remains unchanged). The resulting gap in seats won is our measure of bias.
The sources of electoral bias
Our method can also reveal the sources (or components) of that bias. Under FPTP, electoral bias can arise from several different sources. For instance, if one party tends to be more popular in seats with smaller electorates than its rival, it will require fewer votes to win each seat than will the other.
Where disparities in constituency electorates are deliberately created to produce such an advantage, the electoral abuse is referred to as malapportionment. But malapportionment-like effects can arise ‘naturally’ too, due to population change. We refer to this below as a ‘constituency size’ bias.
A similar effect can be created by measures which ‘protect’ constituencies in some parts of a country compared to others. This relates to seats in Scotland, Wales and Northern Ireland, as populations declined relative to England's. We refer to this below as the ‘national’ bias.
Another malapportionment-like bias can arise from differential turnout rates across constituencies. If a party tends to gain more support in seats where turnout is relatively low, this creates a ‘turnout bias’ in its favour.
Similarly, the relative distribution of third party support can also affect the number of votes required to win a seat, and hence the bias between two parties. A ‘third party votes’ bias occurs when one party in a pair is more popular in seats where third parties win a large share of the vote (but not quite enough to win) and the other party is more popular where third parties’ vote shares are lower. But if one of the pair is more popular in seats won by third parties, the third party effect works against the former party and for the latter (a ‘third party wins’ bias).
A final source of potential bias arises from the relative efficiency with which a party's votes are distributed across seats. Under FPTP rules, to win a seat requires winning just one vote more than the party in second place. Parties with highly efficient vote distribution will waste as few votes as possible, putting most effort into marginal seats. The efficiency bias advantages parties with more efficient vote spreads over rivals with less efficient distributions.
So how the electoral system treat Labour relative to the Conservatives in 2024, and which of these sources (or components) of bias helped or hindered these parties relative to each other?
Electoral bias at the 2024 general election
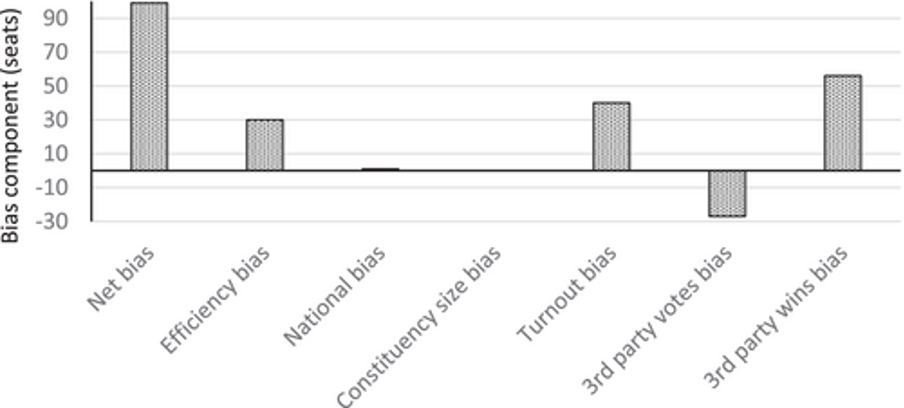
The relative Labour-Conservative biases and the shares attributed to each bias component for that contest are shown in Figure 1. The bias figures represent the difference in number of seats won by Labour over the Conservatives if they tied on their national vote shares at the half-way point between their actual 2024 shares (29.5 per cent each, a 5.1 per cent swing from Labour to Conservative). A positive bias value shows how many more, and a negative value how many fewer, seats Labour would win compared to the Conservatives.

Figure 1: Labour-Conservative electoral bias at the 2024 UK general election
Even had Labour and the Conservatives tied on national vote share, net bias would still have favoured Labour, to the tune of ninety-nine more seats.
Because of new rules for electoral redistricting adopted in 2011, constituency size and national quota biases played little part. But Labour was more popular in areas with lower turnout – 57.2 per cent in the average Labour seat, compared to 64.4 per cent in the average Conservative. This ‘turnout’ bias would have been worth an extra forty seats for Labour.
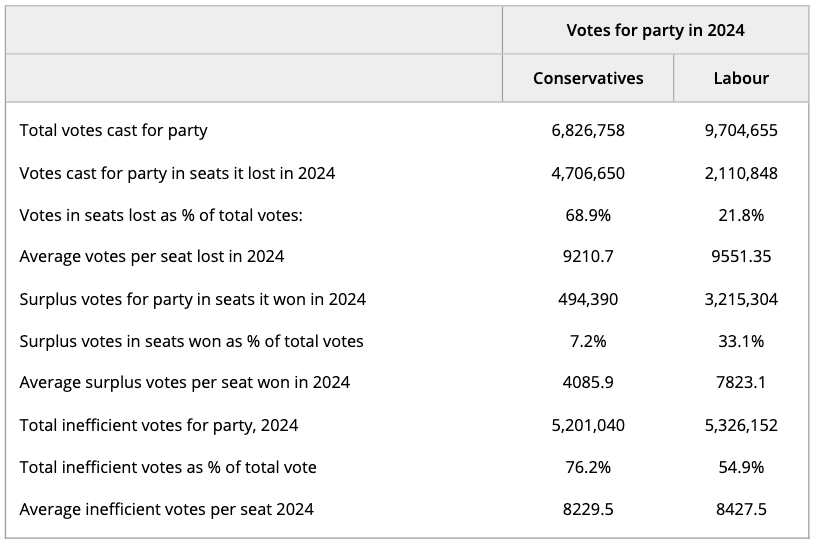
The relative efficiency of Labour's 2024 vote distribution would have netted Labour thirty more seats than the Conservatives. Around 69 per cent of the Conservatives’ 2024 votes were cast in seats the party lost. In contras

Table 1: Inefficient votes for Labour and the Conservatives at the 2024 election
Not all aspects of Labour's vote distribution were quite as efficient, however. Where it won in 2024, it tended to do so by larger margins than its Conservative rivals.
Third party effects had mixed implications. Other things being equal, the third party votes bias was worth twenty-seven fewer Labour than Conservative seats. The bias resulting from third party wins, meanwhile, helped Labour relative to the Conservatives in 2024, to the tune of a fifty-six-seat Labour advantage at equal vote shares.
Conclusions
Labour parlayed its very modest 2024 vote share into a landslide, thanks in large part to how its support interacted the electoral system, relative to its main rival. Greater vote efficiency, more support in low-turnout constituencies, and fewer losses to third parties—largely a function of Labour's recovery relative to the SNP in Scotland and to the Liberal Democrats posing more of a threat to the Conservative than to Labour—stood the party in very good stead. For the first time since 2010, net electoral bias now once again favours Labour over the Conservatives.
Need help using Wiley? Click here for help using Wiley


