
| 7 mins read
Summary
- Britain’s housing crisis partly reflects the tendency for new homes to be delivered in sub-optimal locations.
- A new measure shows that half of the excess demand for housing lies in well-connected, amenity-rich, inner parts of cities and towns but new home completions since 2010 have been directed to peripheral and lower-demand areas.
- A key takeaway is to consider demand when deciding site allocations and conducting planning reform.
- A WhereToBuild mapping tool provides a starting point for such data-driven policy making.
To tackle Britain's acute housing affordability crisis, the Labour government has pledged to deliver over two million homes across Great Britain, in part relying on new Local Authority specific housing targets. Delivering new homes is bound to a complicated, political process where local authorities allocate sites to meet these targets through statutory Local Plans. Private developers must then evaluate profitability and secure individual planning permissions on a case-by-case basis. This process fundamentally departs from the free-market allocation governing most goods and services, where consumer demand plays a central role. Consequently, site allocations do not necessarily reflect where people want to live.
Where do people want to live?
To determine where people want to live, we analyse a novel dataset of over 20 billion housing searches on Rightmove alongside rental and sales listings. Unlike realised house prices—which are skewed by construction costs, wages, and immediate availability—searches provide an unconstrained measure of true location preferences. By subtracting available listings from demand measured by the number of searchers in an area, we construct a hyper-local metric of excess demand in 2024: the "housing gap”.
The resulting spatial patterns reveal that the most severe housing shortages are concentrated within major urban centres, with parts of central London boroughs like Wandsworth, Westminster, and Tower Hamlets and neighbourhoods of Bristol, Manchester, Edinburgh, Portsmouth, and Sheffield ranking within the top 0.5 per cent of excess demand nationally. Crucially, our analysis shows that most of the variance in the housing gap is explained by differences within Local Authorities (LAs) rather than variation that occurs between different LAs. This indicates that housing pressure is an overwhelmingly localised phenomenon, and that authority-wide targets matter less than the specific sites allocated in Local Plans.
Where have we built?
Comparing this hyper-local demand data with historical housebuilding patterns since 2010 reveals a stark spatial misalignment. While approximately half of the total housing gap is in the inner parts of large towns or cities requiring densification (see Figure 1), only 30 per cent of new completions have occurred in these core locations. Instead, development has been disproportionately directed toward peripheral and lower-demand areas with urban extensions and new rural developments substantially overrepresented relative to their underlying market demand.
This bias toward peripheral development is driven by local political incentives and planning constraints, which can favour less contested peripheral locations over higher demand but more contentious urban sites. Consequently, the quality of new-build sites has deteriorated over time in terms of their proximity to essential services and employment opportunities. For example, in the early 2000s, only 11 per cent of new builds were situated in built-up areas lacking access to a GP surgery or secondary school; in recent years, this figure has risen to roughly 18 per cent.
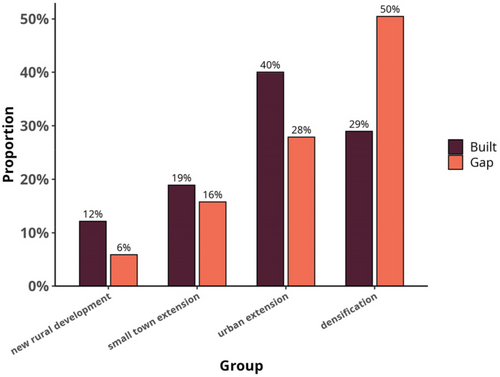
Figure 1: Proportion of Builds vs Gap Across Classifications. Note: Figure shows the proportion of builds after 2010 against the proportion of gap in Great Britain by classification.
Reforming supply
Unlocking delivery where people want to live requires confronting the restrictive planning system. By mapping the housing gap against planning designations (Figure 2), we find that greenbelt land represents the largest planning barrier, accounting for 15 per cent of the total housing gap—equivalent to over 200,000 homes when normalised to England's five-year target.
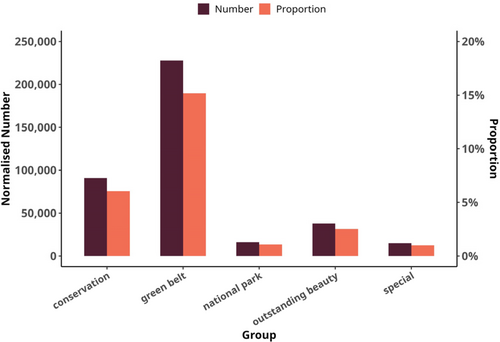
Figure 2: Proportion and Number of Gap by Planning Designation. Note: Figure shows the number and proportion of the normalised gap by planning designation across England. The total gap is normalised to England’s total 5 year target.
However, the pressure on greenbelts is unequal. Across the greenbelts surrounding major cities like Manchester, Liverpool, and Leeds, excess demand is strongly positive, particularly on immediate urban fringes. In contrast, 52 per cent of the London greenbelt is characterised by a negative housing gap. Blanket greenbelt liberalisation is therefore inefficient; instead, a targeted approach allowing construction on the top 10 per cent of greenbelt land with the highest housing gaps would satisfy 55 per cent of all excess demand on greenbelts.
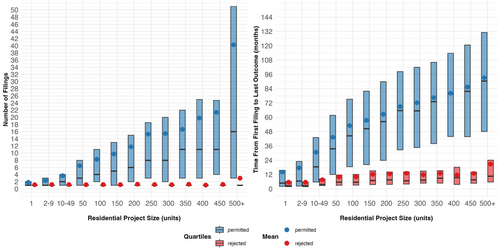
Figure 3: Planning barriers by project size. Note: Boxplots of the number of filings and time from first filing to last outcome by project size for residential planning applications for new units filed in Great Britain from 2000-2025.
Supply-side reform must also address project size and administrative friction. Historical application data shows the increasing reliance on large housing schemes that also face disproportionate bureaucratic barriers (Figure 3). Projects exceeding 50 units require many filings and suffer from prolonged delays, often spending many years navigating the process. Conversely, smaller developments move through the system significantly faster, averaging under two years for projects with fewer than ten units. Because private developers pace construction to match local market absorption rates, building small-scale schemes in high-gap areas can reduce both planning bottlenecks and build-out delays.
Can Labour deliver their targets?
Whether the Labour government can fulfil its housing pledges depends on whether local planning realities can be aligned with spatial demand. Currently, some of the highest-demand regions face the most restrictive planning environments. For instance, London boroughs like Bexley and Lambeth combine ambitious housing targets with extensive planning delays and high refusal rates. Overcoming these bottlenecks will require planning reforms or significant additional capacity. On the other hand, the combination of high excess demand and comparatively low planning frictions in major cities like Birmingham, Manchester, and Leeds presents immediate opportunities for accelerating housing supply.
Our analysis of current Local Plans shows a poor correlation between existing site allocations and true excess demand. Going forward, a key reform which would align areas which can be developed with demand, would be that local plans must take a data driven approach in incorporating demand when deciding site allocations. Our WhereToBuild mapping tool provides a publicly accessible starting point for this exercise.
Need help using Wiley? Click here for help using Wiley


